Whether you’re looking to become a full-fledged crypto trader, or someone who wants to make the occasional move when the timing seems right, you’ll need to know how to read Cryptocurrency charts (crypto charts).
Most people tend to go with their gut when determining whether to sell or buy crypto, and they often end up getting the timing wrong. Crypto charts are not a crystal ball but they’re the best we’ve got and if you can understand them, it can help you make better decisions by removing some of the emotion and guesswork.
Crypto charts offer a data-driven perspective of the crypto market that enable investors to make wiser (or at least better informed) trading decisions.
This article covers the basics of deciphering trading charts, but in order to trade cryptocurrencies successfully you’ll have to apply that knowledge consistently over time. You’ll need to do your own research into any digital asset and decide for yourself whether it’s time to buy the dip or get out while you still can.
Crypto Charts Show Market Prices Over Time.
They’re tools that help visualize relevant trading data for different cryptocurrencies. They show specific price movements, market cap and comparison to other digital assets or the US dollar.
Traders can use short-term data for quick decisive trading decisions or reactions to sudden market changes or they can zoom out to long-term data and gain a broader understanding of where today’s prices fit into a larger market cycle. It is just like a stock market chart, so if you can read those you are well ahead of the game.
Crypto chart data can help traders predict future market movements. Charts let experienced traders make more informed decisions to what the future might hold but no one ever knows for sure. This is especially true with crypto trading.
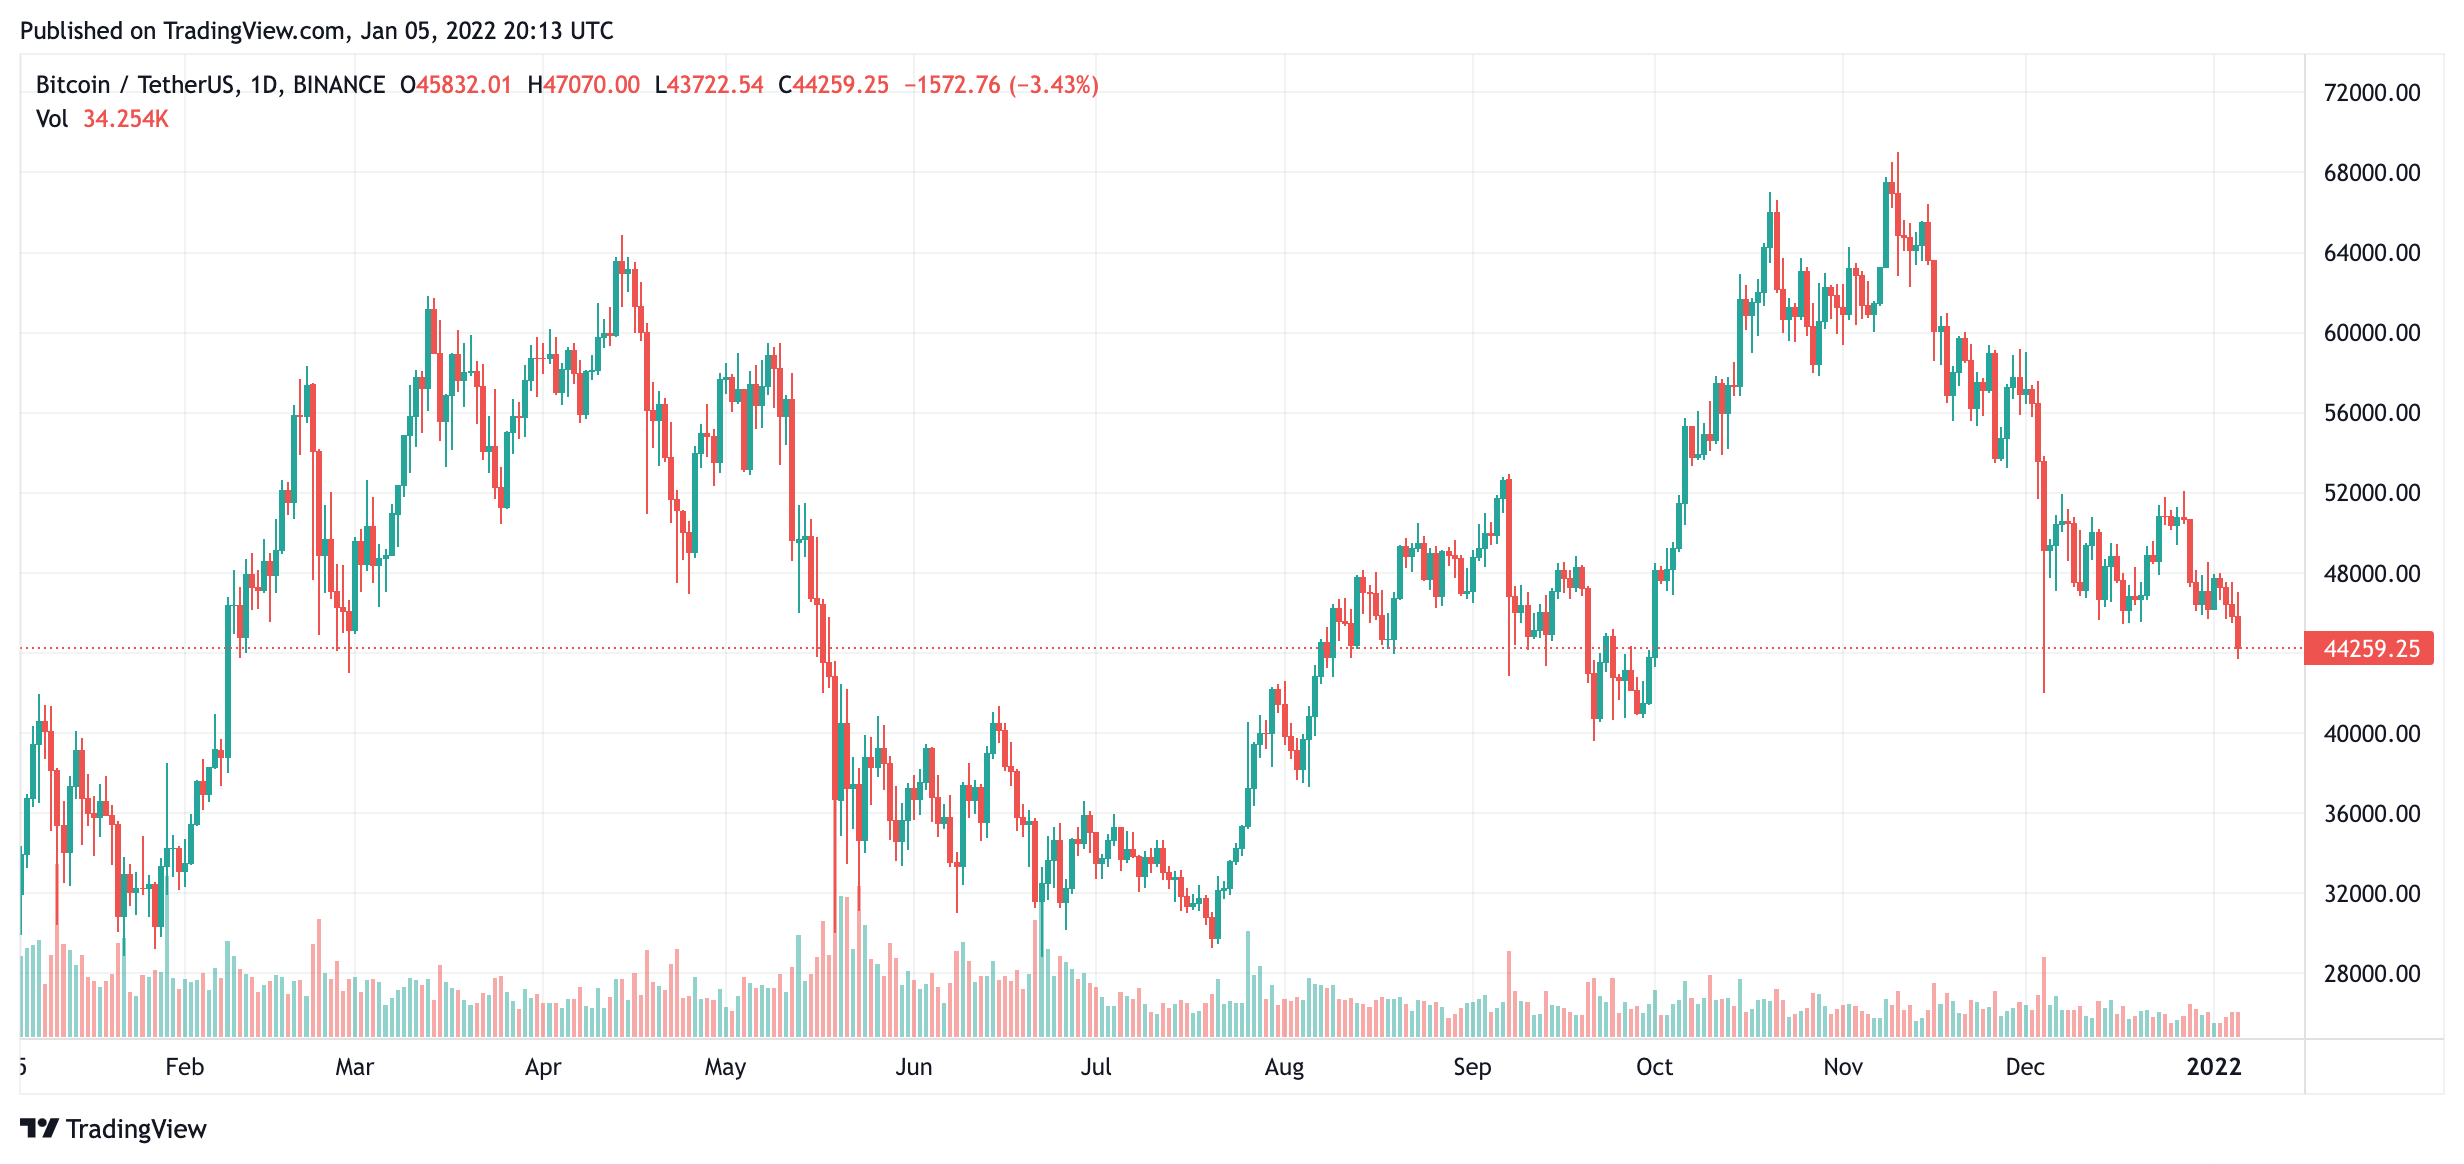
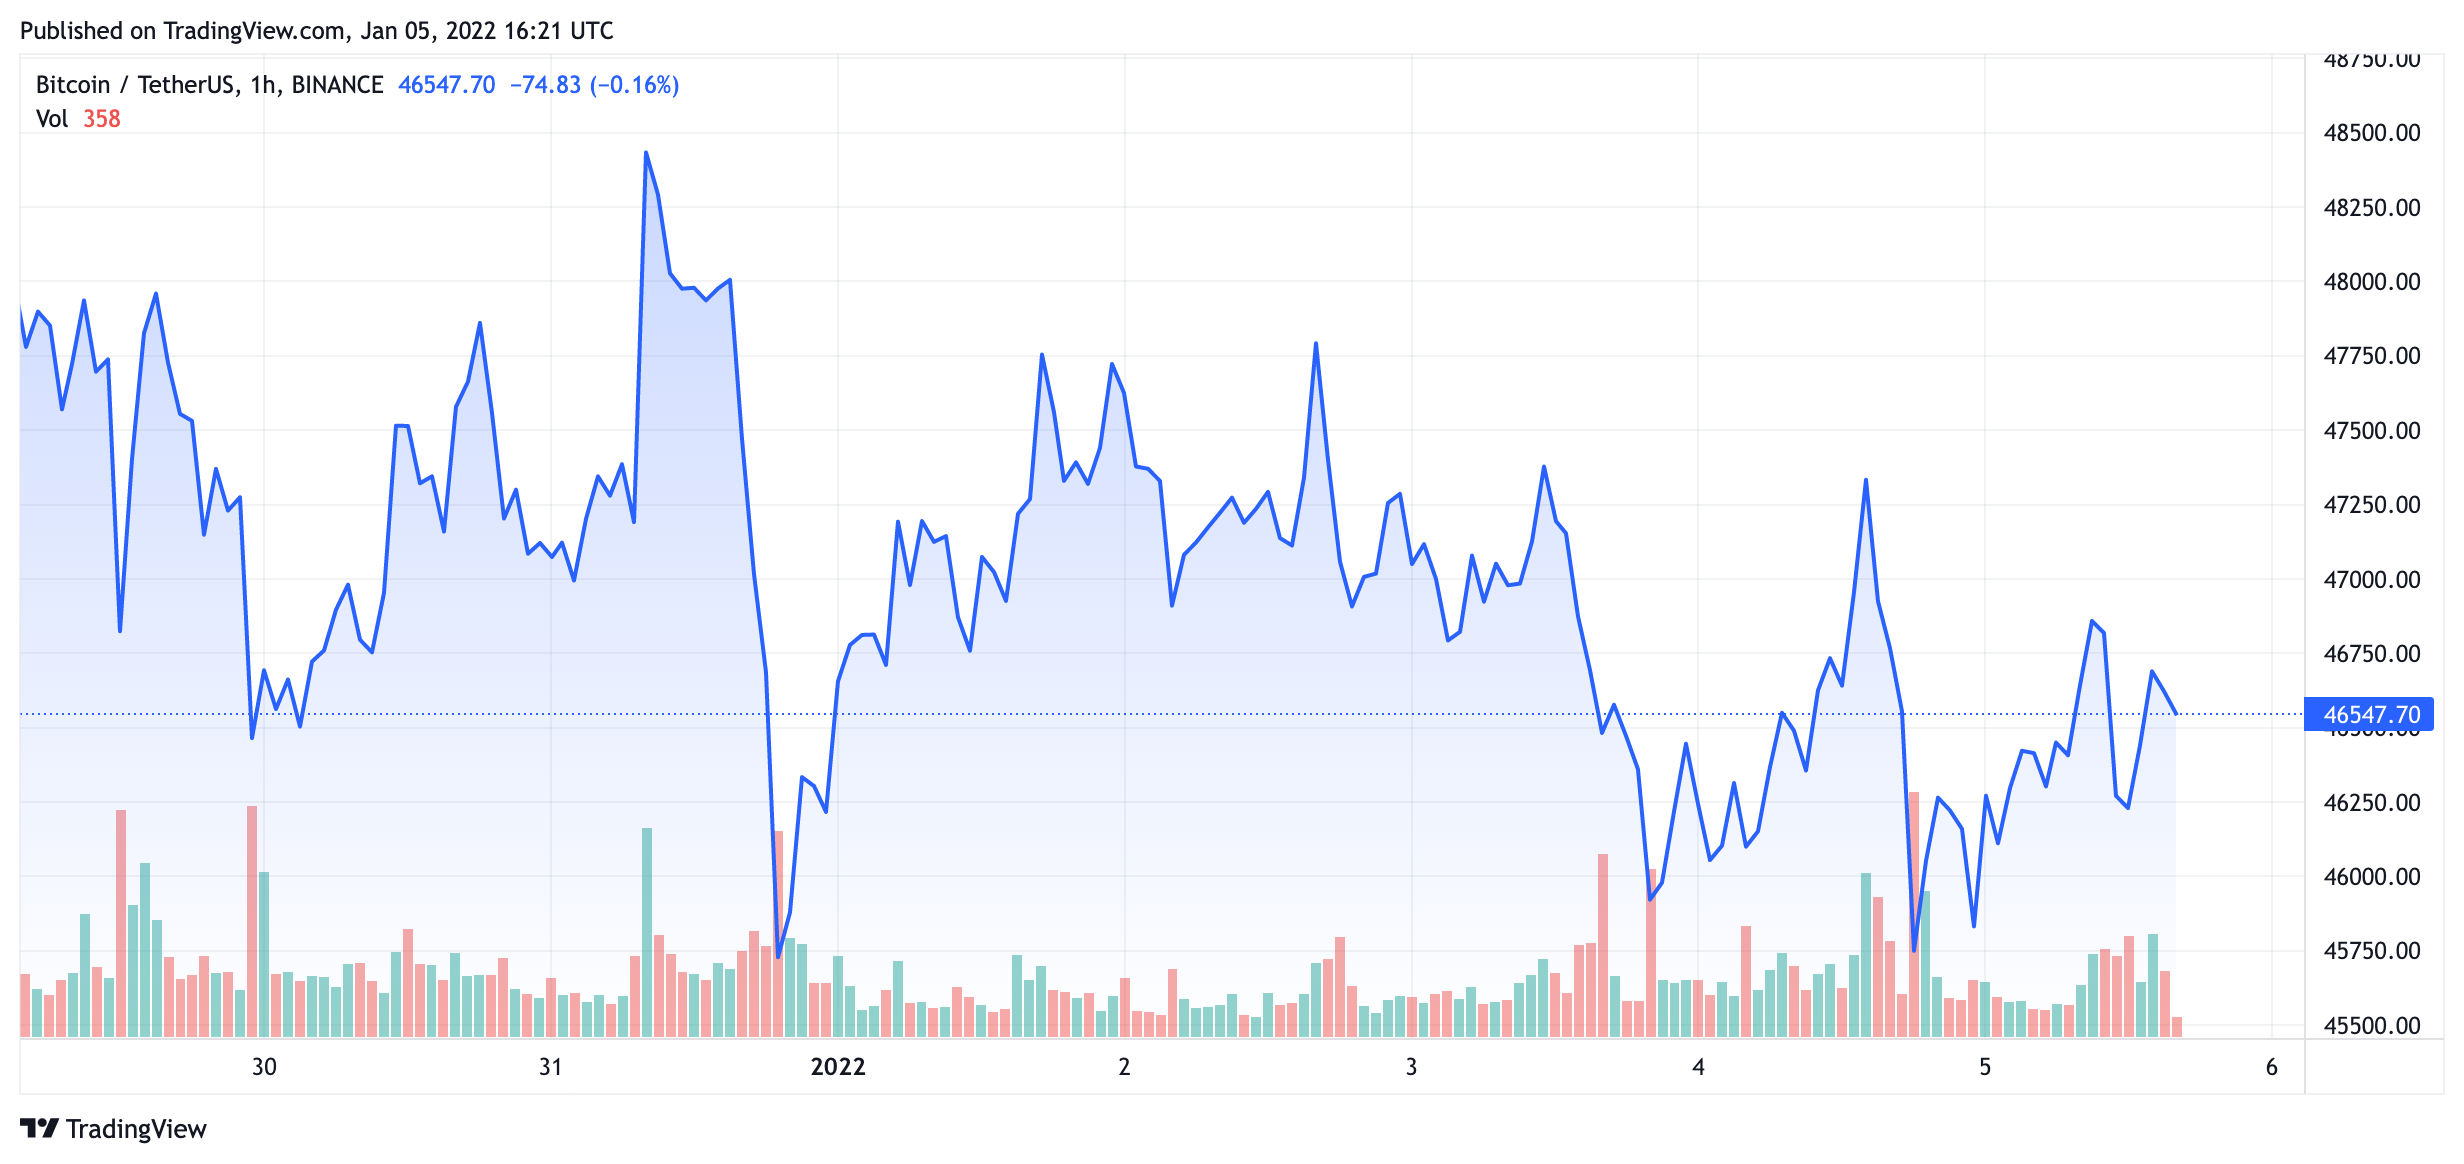
The Bitcoin (BTC) chart looked like this at one time:
– via CoinGecko (TradingView)
– via CoinMarketCap (TradingView)
Advantages of Reading Crypto Charts
Seeing the exact prices over time.
Knowing the exact price of a cryptocurrency helps you determine the best time period to enter or exit the crypto market. Timing is often key and if a price changes suddenly you may see an opportunity to profit. Most charts tell the price of a crypto down to the penny and are updated with live data.
Helping to predict future price movements.
Crypto charts reveal historical price data which enables a trader to get an idea of whether a coin might dip or soar in the future based on general trends or technical analysis.
For example, certain price trends can indicate a common market trend or cycle. This could be based on trends, previous cycles or whether a sudden change in value was due to external factors that are going to either be either long term or short-lived. Like China banning crypto for the 300th time or the SEC considering whether something might be considered a security.
Types of Crypto Charts
The most common types of crypto charts include:
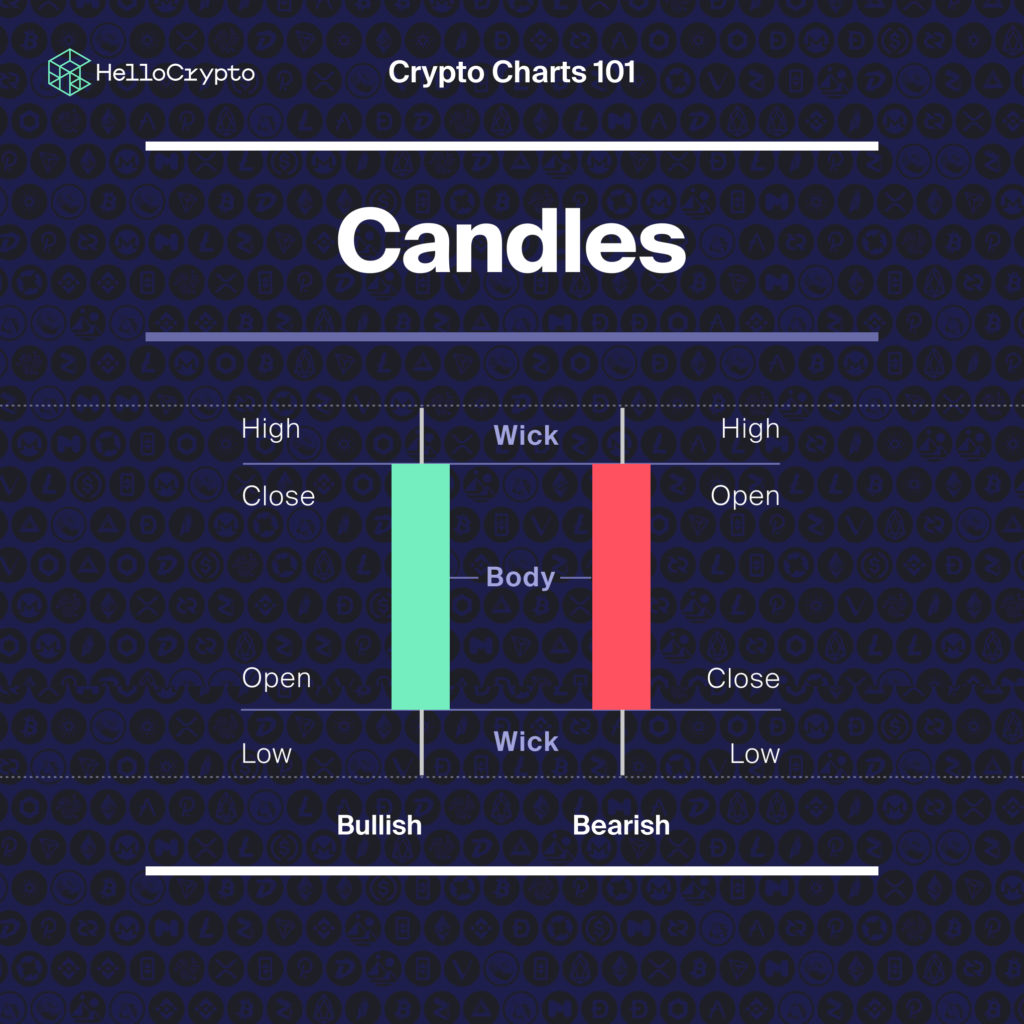
Candlestick Charts
Candlestick Charts are another common type of chart for investors. This chart is loved and widely used by traders as it displays a lot of price change information, much more than a line chart can.
Candlestick charts got their name because each point on the graph looks like a candlestick with a wide part and then a wick sticking out of the top and/or bottom. Everything about the candlesticks is important – the color, candle size, and wick size all provide relevant trading information.
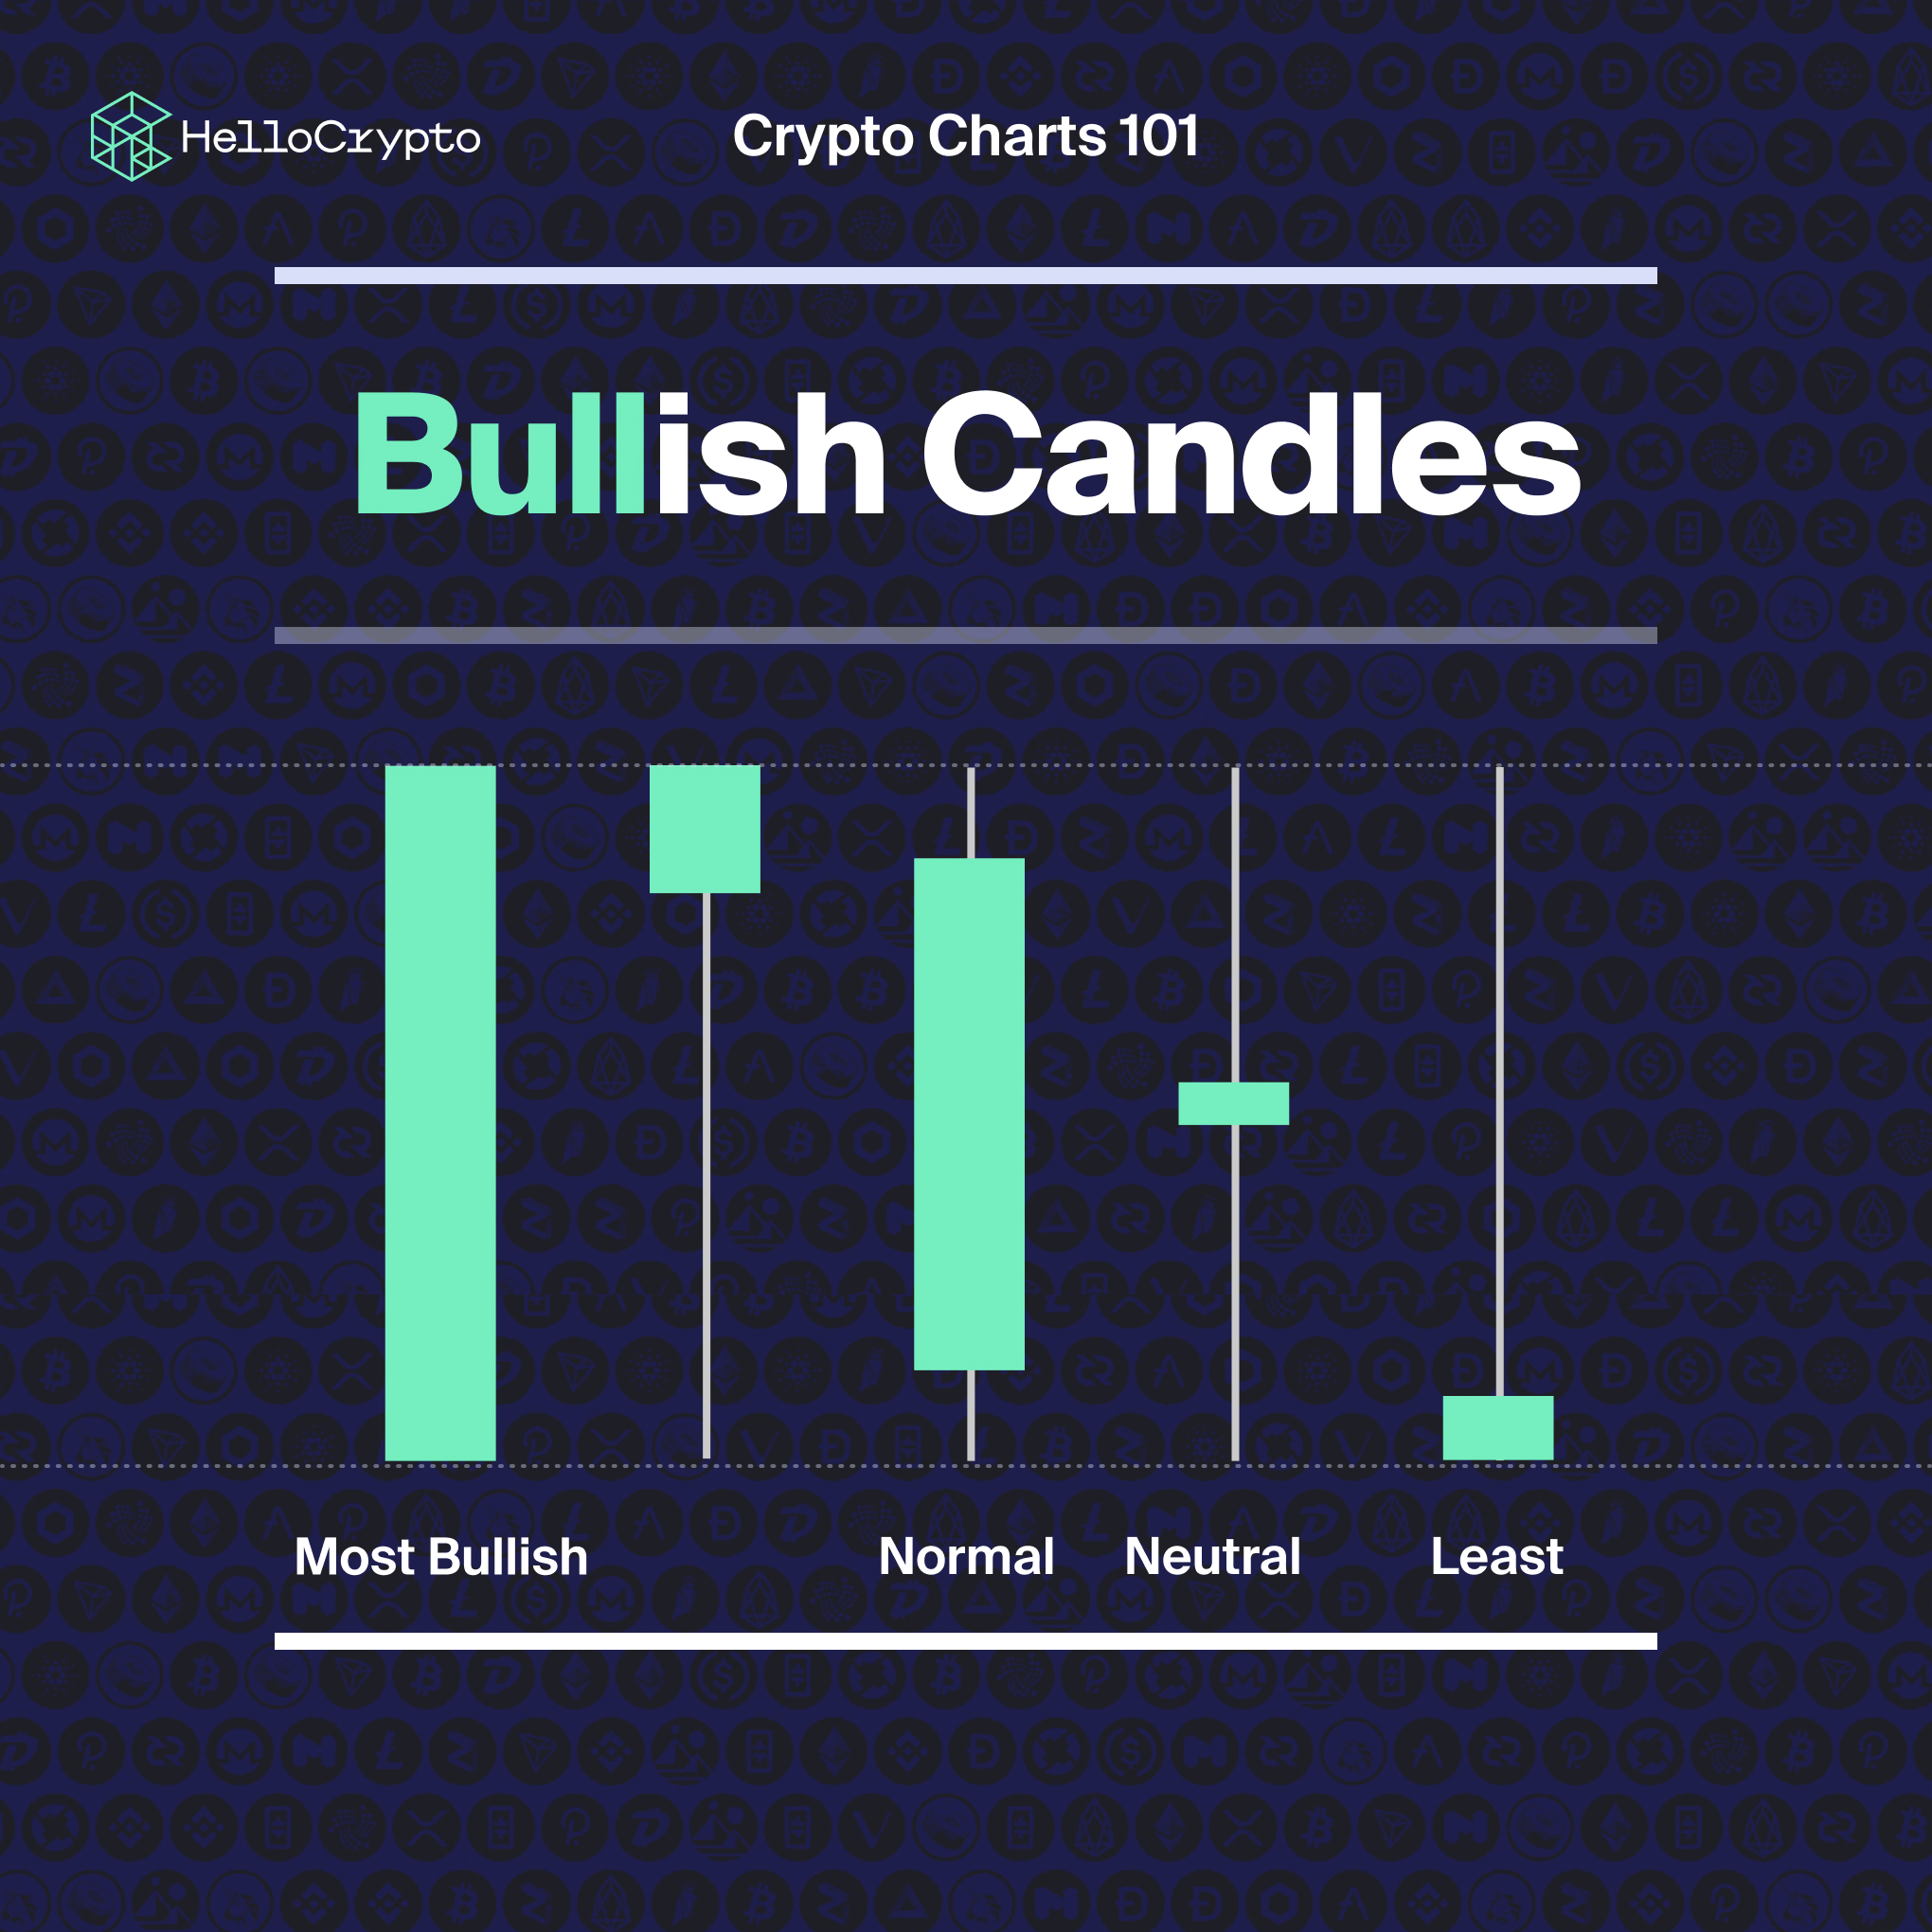
Green candles (Bullish candlesticks) represent an increase in a crypto’s value. The green candle will have the crypto’s opening price at the bottom and the closing price at the top of the body of the candle.
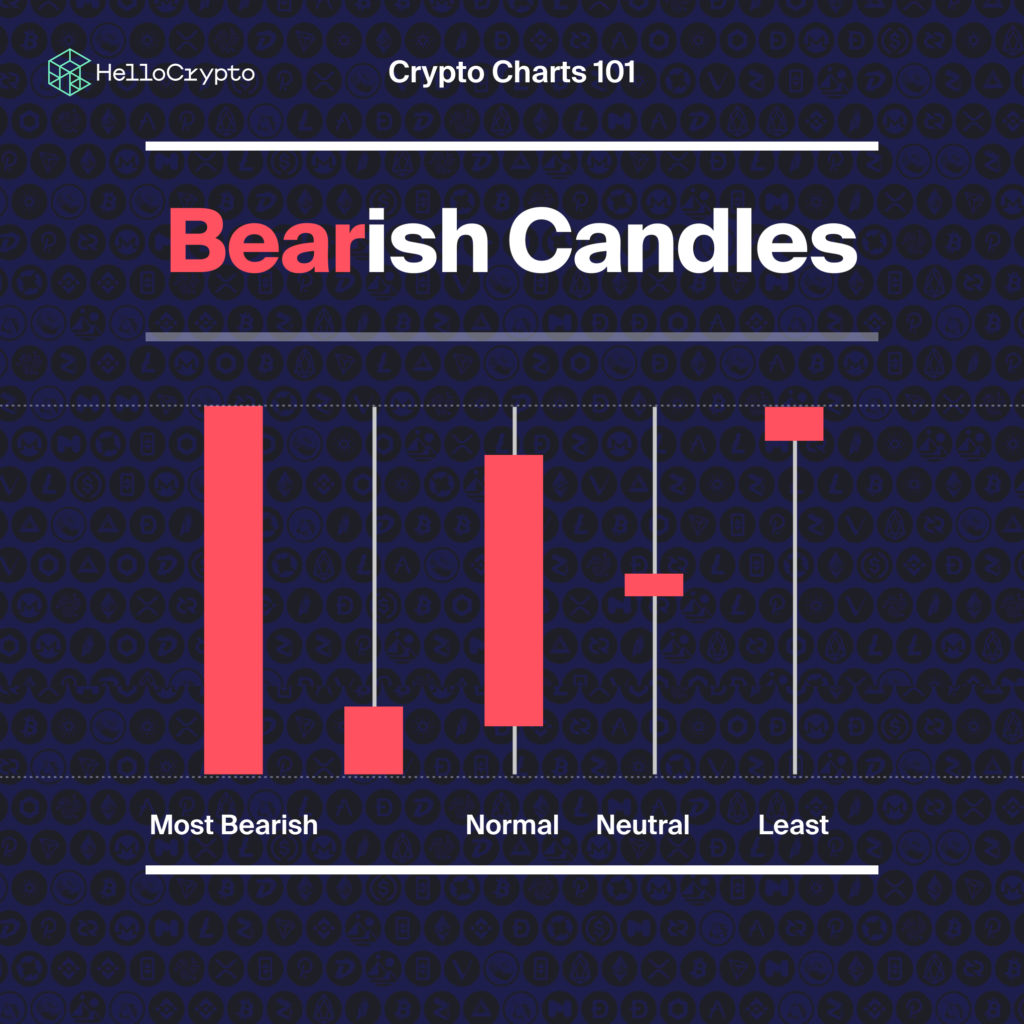
Red candles (Bearish candlesticks) represent a drop in a crypto’s value. The candlestick will have the crypto’s opening price at the top and the closing price at the bottom of the bottom of the candle. A series of successive green candles represent a bullish trend (an uptrend when the price is rising) while consecutive red candlesticks represent a bearish trend (a downtrend when price is headed downward).
The wicks, which either come out at the top and/or bottom parts of the candlesticks, show the highest price range and lowest price range within within the day.
Line Charts
A line chart is one of the simplest crypto charts to read. Line charts were among the first trading charts to be used in financial markets. Their simplicity is one of the many reasons they have been widely used and continue to be used by many traders globally.
A line chart is simply a line showing the movement of a cryptocurrency. If the line is moving averages upwards the cryptocurrency price is an uptrend. If the line is moving downwards the cryptocurrency price is trending down, as simple as that. In addition, some charts have the option of also display a trendline (or a line of best fit) which is a straight or curved line in a chart that shows the overall pattern more clearly.
Support and Resistance Levels
Another part of Technical Analysis is looking for Support and Resistance Levels. This technique requires lots of practice to master, but when you do, it will make your trading easier.
Support level is an area where the price of a cryptocurrency fails to drop below – its lowest point.
Resistance level is the area where the price of a cryptocurrency fails to increase past – it’s highest point.
Support and Resistance levels exist due to a particular influx of buyers or sellers at various points. Understanding these levels can help predict the future price behavior of a cryptocurrency.
Trading Volumes
Trading volumes give traders another signal about market trends. It illustrates the amount of enthusiasm around a crypto coin. If a coin has a large trading volume, it means more people are trading the coin with the increased demand resulting in price appreciation for the coin. If less people are trading the coins, the volume drops and usually so does the price of the asset. Very low volume means an asset is more obscure and may be harder to buy or sell.
Trading volume helps with determining the coming of a bullish or bearish market sentiment. Fading volume when the price is still increasing is an indication of upcoming reversal.
Bulls and Bears
Bulls and Bear represent different market trends – an upward market trend is known as a bull market while a downward trend is a bear market.
The Bull represents an enthusiasm. The term Bullish market or Bull Run is one you’ll encounter in crypto trading as well as traditional investing. A Bullish market is one where cryptocurrency prices are generally going up, so it represents a positive market trend. A bull market takes place when there is more demand from investors to buy cryptocurrencies than there are sellers. Buying specific cryptocurrencies leads to scarcity of the coins resulting in their prices going up.
Bullish candles are green.
A Bearish market is one where crypto prices are declining – the opposite of the Bull market. A Bear market usually takes place when there is more supply from sellers than buyers. Investors may have lost confidence in the future price of the coin or greater market conditions, so there are more sellers than buyers.
Bearish means red.
Though it’s easier to make money in a Bear market, smart investors can make money in a Bull market as well.
Timeframes for Crypto Charts
Timeframes for crypto charts range from seconds, minutes, hours, to weekly and even monthly, so that you can get a sense of both what’s happening in the moment and also the larger trends.
Timeframes of crypto charts align to different trading strategies, most simply short-term and long-term traders.
Long-term traders usually hold investments for years at a time. The most successful traders will HODL their assets until the peak of a Bull Run before taking profits, and then buy them right back once the Bear returns. This is easier said than done obviously.
Position traders
Position traders focus on long-term price movements. They tend to use weekly and monthly price charts to identify potential entry and exit points. They do not worry about minor price fluctuations because their chosen trading period eliminates the need to constantly monitor price movements.
Short-term traders include swing traders, day traders, and scalpers.
Swing traders
Swing traders hold trading positions for a couple of days, although sometimes they can extend to as long as a few weeks. Because of the length of their trading periods, swing traders don’t have to stay glued to their screens monitoring charts and their trades every minute, but timing is still very important.
Day traders
Day traders usually hold trading positions for less than 24 hours. They enter and exit their positions on the same day. By the end of the day, you can close your position with either a profit or loss. Day trading is pretty intense, but wait until you hear about scalpers.Scalpers: Scalp traders are the shortest of short-term traders. The trade time are usually 5 to 30 minutes. The idea here is to make lots of quick trades that result in small profit gains. Scalping is a demanding and intense crypto trading form that is not for everyone.
Top Crypto Analysis Tools
There’s no shortage of sites or apps that display crypto charts and offer analysis. These are a few that we’ve used and like:
CoinGecko
CoinGecko offers real-time crypto price data. They cover over 1000 coins, trading pairs and exchanges. CoinGecko also allows you to view and sort data by categories like: Smart Contracts, Ecosystems, DeFi, Metaverse or NFTs.
They also have a portfolio app that you can download and customize to track the performance of specific assets over time.
Related: CoinMarketCap vs. CoinGecko
CryptoWat
Launched in 2014, CryptoWat is a real-time crypto market platform that is currently owned by Kraken, a US-based cryptocurrency exchange. The platform provides real-time cryptocurrency data, charting, and trading services for over 25 cryptocurrency exchanges, including Binance, Binance.US, Coinbase Pro, Coinone, Bittrex, Bitstamp, Huobi, and BitMEX among others.
CryptoWat has lots of trading features with some available for free and others only accessible for premium users. This means there are features you’ll have to pay for to use. The free features offer a great starting point for people looking to test what CryptoWat is all about before investing in it.
Key features include:
- Portfolio tracking
- Price indicators
- Liquid bids
- Charting interface
- Trollbox
TradingView
TradingView is a popular trading platform that boasts over 30 million traders. The platform is liked by many traders as it is easy to use, more affordable than most of its competitors, and highly configurable. Any skill level can use TradingView, including beginner, intermediate, and professional traders.
TradingView stands out as a trading platform that is accessible everywhere, even in China. The platform is also accessible through mobile devices.
TradingView has lots of features. Some free and others available only for premium users.
Key features include:
- Charts
- Watchlist
- Indicators
- Alerts
- Screener
- Live streaming service
- Live chat feature
Final Word
Understanding how to read charts is vital for any crypto trader.
Reading crypto charts comes down to analyzing historical price movements and using this to make an educated guess as to where they might be headed next.
Comprehensive historical data can help you make critical trade decisions.
Understanding how to read crypto charts lets you know the exact price of a cryptocurrency, as well as decide when to enter or exit crypto the market.
Consider Dollar-Cost Averaging
In my humble opinion, a better investment approach for most people is to use a far simpler trading strategy like Dollar-Cost Averaging. DCA comes down to investing a set amount over time consistently. It tends to work out well over time.
— Mark
Read: What is Dollar-Cost Averaging?
Good luck.